- The UK is just under 60% self sufficient in vegetables and just over 10% self sufficient in fresh fruit.
- The UK has the second largest consumption of organic produce in the EU.
- The production and sale of most crops produced in the UK are regulated by the EU through the Common Agricultural Policy (CAP). When the CAP was reformed in 2003, the link between subsidy and production was broken (decoupled) leaving farmers free to produce for the market.
- In addition, for fruit and vegetables, CAP support is available under the EU Fruit and Vegetables Regime for Producer Organisations.
- Defra is working with the fruit and vegetables industry to increase the domestic production and consumption of fruit and vegetables. Defra has established an industry taskforce to identify and overcome the barriers to increased production and consumption.
- There are seven UK based organic control bodies currently approved by Defra (Soil Association Certification Ltd, Organic Farmers and Growers, the Organic Food Federation, Quality Welsh Food Certification Ltd, the Biodynamic Agricultural Association, the Scottish Organic Producers Association and Asisco).
Data regarding orchards
I extracted this data from DEFRA's table of Food imports and exports. this is the £ value of Fresh apple import and exports:
| Imports (£000) | Exports(£000) | |
| 1988 | 170,011 | 5,502 |
| 1989 | 168,470 | 6,252 |
| 1990 | 218,267 | 6,313 |
| 1991 | 220,036 | 10,986 |
| 1992 | 227,103 | 10,127 |
| 1993 | 184,600 | 5,235 |
| 1994 | 220,768 | 6,205 |
| 1995 | 244,172 | 11,502 |
| 1996 | 280,910 | 16,037 |
| 1997 | 272,401 | 9,624 |
| 1998 | 237,221 | 8,052 |
| 1999 | 243,565 | 8,166 |
| 2000 | 234,074 | 8,848 |
| 2001 | 250,613 | 7,892 |
| 2002 | 251,011 | 7,395 |
| 2003 | 282,973 | 8,761 |
| 2004 | 300,687 | 10,836 |
| 2005 | 293,706 | 9,004 |
| 2006 | 312,604 | 15,796 |
| 2007 | 319,623 | 13,198 |
| 2008 | 328,025 | 9,410 |
| 2009 | 326,174 | 9,482 |
From this data I calculated both imports and exports increased as follows:
| Imports | Exports | ||||
20 years | 157,705 | 94% | 3,230 | 52% | |
| 10 years | 82610 | 34% | 1315 | 16% |
Whilst it is positive that our exports have increased they are still much lower than Imports. In fact exports have more or less always been 3% of imports over the same period. In the last 20 years imports have increased by 94%.
To understand the British position better I need to find out what our Apple consumption is and what % of this is British apples. As my I extend the research I am finding that as Apple branding has increased ie from the 70's French Golden delicious and more recently Pink Lady so our consumption of foreign apple as as increased. I don't think this is so bad perhaps when British apples are out of season but why consume six month old South African apples when you can consume fresh British ones? These are much healthier which is ultimately the main reason we eat, for our health and well being!
Although I have found that certain supermarkets are actively supporting British apples. I think there is a 'gap' in education about the quality of the apples we are actually eating in terms of how old ,how travelled and also perhaps re-educating our taste buds!
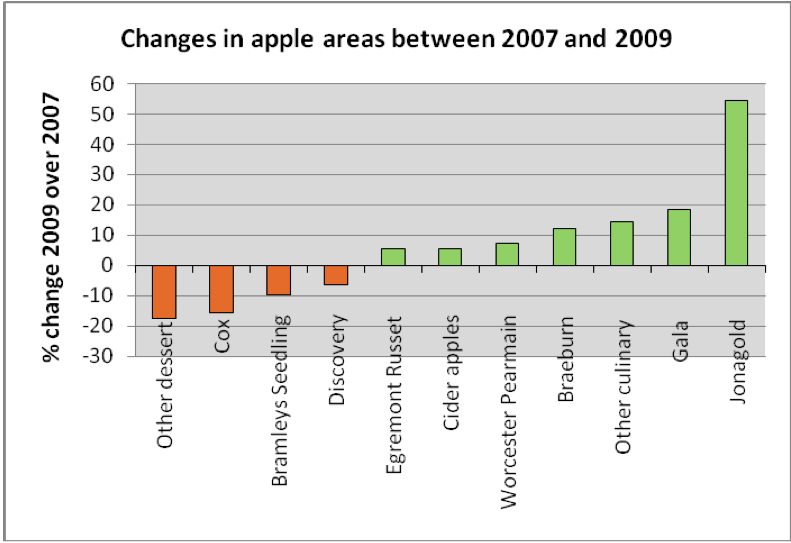
Data regarding the variety of apples grown in Britain

This table demonstrates British growers attempt at competing with imports by growing more varieties.
Another approach with Apples stats could be comparing the apple output of each country with the population and land area available. I was quite disappointed that we are ranked only 27th in the worl in terms of output especially as Apples are something we can grow naturally. Also the fact our orchards have depleted 50 % in the last twenty years giving way to more profitable rye crops. However the fact is China is the largest producer of apples but it has a much larger land area and population. I think I will also investigate what % of each country actually export their produce
A BBC news reports from Sept 2010
1 in 3 apples consumed in UK are grown in UK
Mis-shapen and blemished apples don't reach shops (20%) of output
UK 110,000 tonnes produced
1 in 3 apples consumed in UK are grown in UK
Mis-shapen and blemished apples don't reach shops (20%) of output
UK 110,000 tonnes produced
Friends of the Earth report 2005
Slightly out of date stats about worrying apple supply stats of supermarkets in UK
Further stats are available on the EU website
Nutritional value

An average apple costs 25-70p(Cheaper than a choc bar!)
Apples are strictly controlled and categorised by different classes
I was finding it tricky to obtain an analysis of the UK imports of apples. I found 2003 stats via a report about Pesticides prepared by DEFRA. They had used HM CUSTOMS Intrastat data.
The Standard International Trade Classification (SITC)
Established by the United Nations, the SITC was intended to be used by governments for their external trade statistics. Up until the HS was adopted, the SITC was the only trade classification which enabled comparisons to be made on a worldwide basis.
To obtain the stats for apples I need the SITC code. All the data is extractable via spreadsheets.

I registered on the HM Customs website so i was able to define my own report. This was a learning curve in itself. As follows:


These reports can be downloaded into Excel so i was then able to manipulate the data and produce charts as follows:
| UK World Trade 2010 - SITC | ||||
| 2010 | 1000 | |||
| Country | Tonnes | % | ||
| SITC | FRANCE | 155,875 | 34% | 1 |
| 05740:APPLES, FRESH | SOUTH AFRICA | 83,336 | 18% | 2 |
| NEW ZEALAND | 36,255 | 8% | 3 | |
| CHILE | 35,242 | 8% | 4 | |
| NETHERLANDS | 26,887 | 6% | 5 | |
| ITALY | 24,931 | 5% | 6 | |
| GERMANY | 21,203 | 5% | 7 | |
| UNITED STATES | 17,594 | 4% | 8 | |
| Others | 16,079 | 3% | ||
| BELGIUM | 17,154 | 4% | 9 | |
| SPAIN | 7,856 | 2% | 10 | |
| BRAZIL | 7,275 | 2% | 11 | |
| IRISH REPUBLIC | 5,775 | 1% | 12 | |
| PORTUGAL | 5,355 | 1% | 13 | |
| Total | 460,818 |


From this data I am also going to calculate the food miles travelled by the Apples we eat(approximately)
No comments:
Post a Comment